")
Having discussed how the Bollinger Bands works in my previous post, the crux of today’s discussion is RSI – another crypto trading indicator.
The Relative Strength Index(RSI) is an oscillator indicator. This simply means that it points out overbought and oversold conditions.
It can also help to confirm a trend – whether bullish or bearish.
On several occasions, you must have heard of RSI saving the day or RSI showing the way.
Well, the RSI is neither a prophet nor a fortune-teller; it is merely an indicator.
In this post, you will learn how the RSI indicator works, its setup, how it works, and how to use it when trading cryptos.
Join up with me so together, we can explore extensively the RSI-sphere.
RSI Post Summary
For today’s discourse, we will be looking at the following subheadings:
- What is RSI?
- RSI Setup and How It Works
- Ways of Using RSI
- RSI Usage in Crypto Trading
- Frequently Asked Questions
- Conclusion
To view the full details of each subheading, just click on it.
So, grab your writing materials as the discussion will be starting right in the next section.
**Heads up!!
Today’s post is #5 in the Chart 101 series.
For a complete understanding of the series, read in this order:
- Crypto Trading Indicators – What are They?
- Fibonacci Retracement – Is It Reliable?
- Moving Average Convergence Divergence(MACD) – A Complete Analysis
- Bollinger Bands – How Good Is This Indicator?
- Relative Strength Index(RSI) – An In-depth Review
- The Moving Average(MA) Analyzed -A Complete Guide
- Engulfing Candlestick Pattern – How Does It Work?
What is RSI?
The Relative Strength Indicator(RSI) is a popular indicator developed by a technical analyst named J. Welles Wilder in 1978.
He created as a tool that traders can use to examine how an asset is performing over a certain period.
It is a momentum oscillator i.e it gives traders an idea of how momentum is developing on specific currency pairs.
Momentum is the rate of the rise or fall in price.
When the momentum increases, it shows that the price is rising. This clearly indicates that the coin is being actively bought in the market.
But if the momentum decreases, it is a sign that the selling pressure is increasing.
It evaluates an asset’s price on a scale of 0 to 100, considering 14 periods.
Having explained what RSI is, I will be discussing it’s set up and how it works in the next section.
Just scroll down.
RSI’s Setup and How It Works
The RSI works like the regular pendulum or alternating waves. It moves to and fro, or back and forth within 0 and 100.
To determine this, a formula is used:

Now, I hope you are not getting scared thinking you will have to solve this calculation before you can predict a move?
Just relax… The good thing is that the calculation has already been solved for you by the indicator.
The only thing you need to do is set the indicator period that best suits your trading style.
The formula divides the average gain the price has had over that time by the average loss it has sustained and then plots data on a scale from 0 to 100.
By default, the RSI measures the changes in an asset’s price over 14 periods (14 months on monthly charts, 14 days on daily charts, etc).
Although the default settings for RSI is 14 periods, traders may decide to modify it so as to increase sensitivity (fewer periods) or decrease sensitivity (more periods).
Therefore, a 7-day RSI is more sensitive to price movements than an RSI of 21 days.
I explained ways you can use this indicator in the next section.
Read on.
Ways to Use RSI
The RSI indicator ranges from 0 to100 but it is usually calibrated at levels 30, 50 and 70. These 3 levels are the most significant RSI levels.
If the RSI is less than 30, it means that the market is oversold.
Conversely, if the RSI is more than 70, it means that it is overbought.
Level 50 is the midline that separates the upper (Bullish) and lower (Bearish) territories.
In an uptrend, the RSI is usually above 50, while in a downtrend, it is below 50.
The RSI indicator is used to identify signals such as:
1. Overbought/Oversold Signals

The RSI helps traders to spot overbought or oversold market conditions.
An RSI score of 30 or less suggests that the asset is probably close to its bottom (oversold); a situation in which prices have fallen more than the market expectations.
An above 70 score shows that the asset price is probably near its high (overbought) for that period; a situation whereby prices have risen more than market expectations.
Short-term trading setups may adjust the RSI indicator to consider 20 and 80 as oversold and overbought levels (instead of 30 and 70).
Thus, it will be less likely to provide false signals.
In cryptocurrency trading, you are expected to buy at the dip and sell at the rise.
Note: The indicator does not show when to either buy or sell, but gives an idea of what the next price direction is likely to be.
2. Trend Confirmation

Whenever a dip occurs and a continuous rise is detected, a movement :
- above level 50 confirms an uptrend
- below level 50 confirms a downtrend
3. Reversal Trading

Besides the RSI scores of 30 and 70 which may suggest potentially oversold and overbought market conditions, traders also make use of the RSI to try and predict trend reversals.
Reversal trading has proven to be one of the safest trading strategies.
Such an approach is based on the so-called bullish and bearish divergences.
The bullish divergence occurs when the price and the RSI scores move in opposite directions.
So, the RSI score rises and creates higher lows while the price falls, creating lower lows.
This is an indication that the buying force is getting stronger despite the price downtrend.
Likewise, bearish divergences may indicate that despite a rise in price, the market is losing momentum.
Thus, the RSI score drops and creates lower highs while the price increases and creates higher highs.
4. Trade Exit Points

RSI can be used to detect when to leave a trade and still keep your profits.
You can exit at 2 key points:
- When it reaches an overbought.
- Or hodl till it comes out of an overbought level i.e just before it becomes oversold.
5. Midline Crosses

This is another way the RSI indicator can be used to detect exit points.
When the price crosses the midline(50), it is assumed the price has been overstretched and thus, will return back below the midline.
This is a good point to leave the trade.
6. Support and Resistance
Just like in the QFT strategy, the overbought and oversold levels serve as strong support and resistance levels.
I will go ahead and show you how to trade cryptos using RIS.
RIS Usage in Crypto Trading
In trading cryptos using RSI, you will take the following steps:
- Of course, you need to sign up or log in to a Trading Platform or Charting tool say tradingview.com, for instance.
- Click on ‘Chart’ and it will open up to the trading area.

- In the trading area, make a choice of the trading pair and the exchange to use.

- Select a time frame (minutes, hours, days, weeks, etc)

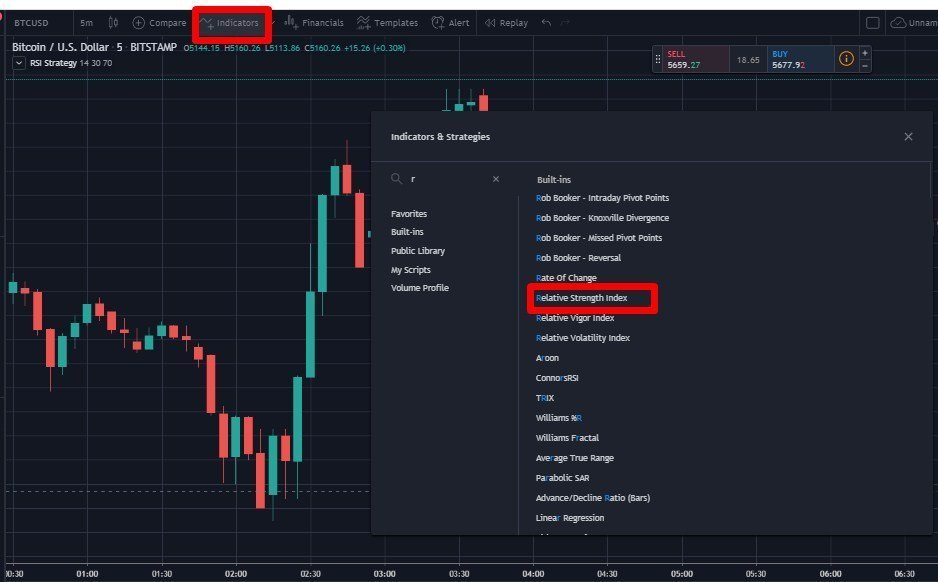
- Click on ‘Indicators’ at the top of the chart and select the ‘Relative Strength Index ’ indicator from the dropdown menu.
- The indicator is then displayed below the chart. You can adjust the period and the colour and type of lines to be displayed. Now depending on what you are checking for, you can make your deductions from the indicator.

Frequently Asked Questions(FAQs)
The RSI is a momentum indicator that will provide you with the information relative to the timing of an entry into a trade by letting you know if bullish or bearish momentum is developing.
Now, how good RSI is will depend on the knowledge and understanding of the person who uses and interprets it; just as the success of a golf player will depend on his/her own ability than on the golfing instrument or area.
On its own, every indicator presents a valid representation of how the algorithms behind it interpret price action.
I will advise that you study the RSI extensively because how well you learn to use it will determine, to a large extent, how successfully you will trade.
For this, I will say it all depends on the trader and the style of trade.
Though the default 14 period is okay for many cases, advanced and intermediate traders can choose to increase or decrease the period slightly to suit the market condition(whether long or short) they are entering.
The RSI indicator uses data gathered from previous trading sessions to reach a reasonably accurate conclusion if a coin is being overbought or oversold.
When you decrease the timeframe, the index has fewer data to draw its conclusions from. As such, the chart becomes more sensitive as the period decreases.
In the same way, increasing the timeframe for RSI increases the amount of data that is factored into the calculation of the index. Thus, data becomes less sensitive as the period is elongated.
You can combine it with other crypto trading indicators such as:
– MACD
– Bollinger Bands
– Average Directional Index(ADX), etc
[widget id=”custom_html-4″]
Conclusion
The RSI indicator is one of the most popular trading analysis tools that is known for its versatility.
For better results, use this indicator in combination with other trading indicators.
We just moored into harbour from the RSI-verse…Bet you’ve got some exploration experience to share.
But lemme go first:
Have you had some experience trading with RSI? How did it go?
What is your fave time setting when trading with RSI?
Which other indicator is the best fit for you to combine with RSI?
Now, it’s your turn… Let me know your replies, experiences, or even questions in the comment section below.
And as is our tradition here, just click on your fave social media button to share this post.
Find the share buttons below.

")

0 Comments