 Indicator")
In my last post, I discussed the RSI and today will have me fixing my review lenses on the Moving Average indicator.
Moving Average(MA) is an indicator that helps to smooth out price movement on the chart.
The name came about from how it works – it takes the average closing price of a predetermined number of periods.
The higher the predetermined period value, the smoother and less reactive the moving average.
This indicator can tell you if a market is trending up or down; giving great insight into how the market is performing.
At the end of this post, you would have understood how MA works and how to use it to predict market movement.
Without wasting any more time, let’s get down to business. You can grab something to jot with as there’s a whole lot to add to your knowledge base today.
Post Summary
To avoid complexities in today’s discussion, find below the subheadings that will drive the day’s discussion:
- Moving Average Explained
- Types of Moving Average
- How to Use Moving Average
- Trading Cryptos with Moving Average
- Frequently Asked Questions(FAQs)
- Closing Thoughts
Click on any of the subheadings to view its details.
The discussion starts right below.
**Heads up!!
Today’s post is #6 in the Chart 101 series.
For a complete understanding of the series, read in this order:
- Crypto Trading Indicators – What are They?
- Fibonacci Retracement – Is It Reliable?
- Moving Average Convergence Divergence(MACD) – A Complete Analysis
- Bollinger Bands – How Good Is This Indicator?
- Relative Strength Index(RSI) – An In-depth Review
- The Moving Average(MA) Analyzed -A Complete Guide
- Engulfing Candlestick Pattern – How Does It Work?
Moving Average Explained
Moving Average(MA) is an indicator that is used to represent the average closing price of the market over a specified period of time.
It helps smoothen price action by filtering out the “noise” from random short-term price fluctuations.
The evolution of MA dates back to 1901, although the name was applied to it later.
Traders use moving averages as it can be a good indication of current market momentum.
MA is considered a lagging or trend following indicator but despite that, it is still able to cut through the noise and point the direction the market is headed.
Traders can use various types of moving averages to establish short-term or long-term trades.
I discussed the types of MA below. Just scroll down.
Types of Moving Average(MA)
In spite of the various types, the MAs are most commonly broken down into 2 separate categories. They are:
- Simple Moving Average(SMA)
- Exponential Moving Average(EMA)
The Simple Moving Average(SMA)
The Simple Moving Average (SMA) is the simplest type of moving average in chart analysis.
The SMA takes data from a designated period of time and produces the average price of that security for the data designated.
The formula for SMA is:
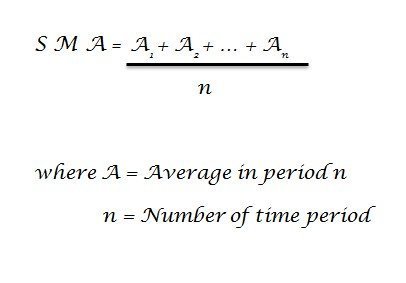
For example, looking at a 5-day SMA on a daily chart of BTC/USD and the closing prices over the 5 days are as follows:
1: 6.321
2: 6.301
3: 6.325
4: 6.327
5: 6.326
SMA = (6.321 + 6.301 + 6.325 + 6.327 + 6.326)/5
= 31.6/5
= 6.32
With SMA, as soon as a new data set is entered, the oldest data set is neglected. For instance, if the SMA calculates the mean based on 10 days worth of data, the entire data set is constantly being updated to only include the last 10 days.
That is, the 10 days moving average would average out the closing prices for days 1-10 as the first data point. Then, the next data point would drop the earliest price(day 1), add the price on day 11 and take the average, and so on.
Worthy of note is that all data inputs in an SMA are weighted equally, regardless of how recent the inputs are.
Some traders who believe that there’s more relevance to the newest data available often state that the equal weighting of the SMA is detrimental to the technical analysis.
To correct this, the exponential moving average (EMA) was created.
The Exponential Moving Average (EMA)
EMAs are similar to SMAs in that they provide technical analysis based on past price fluctuations.
But then, its equation is a bit more complicated because EMAs allot more weight and value to the most recent price inputs.
The formula for EMA is:
EMA = [Close – Previous EMA] x (2/n+1) + Previous EMA
Where n = Number of selected period
Previous EMA = EMA before the recent one
(2 / n+1) = This is the multiplier for weighting the EMA (the smoothing). It follows the formula: [2 ÷ (selected time period + 1)].
Read more about ‘The Smoothing’ in the FAQ section below.
For example, a 4 days EMA with prices of 1.255, 1.256, 1.258, and 1.260. Using the above formula:
EMA = (1.260 – 1.258) x (2/4+1) + 1.258
= 0.002 x 0.4 + 1.258
= 1.2588
With the last value being the most recent it gives a current EMA value of 1.2588 after the calculation.
Exponential Moving Averages respond faster to price movements than the Simple Moving Averages. It basically shows you what is happening in the market presently rather than what happened a few days or months ago.
And because EMAs are more likely to project price reversals faster than SMAs, they are favoured by traders who are engaged in short-term trading.
It is important for a trader or investor to choose the type of moving average according to his personal strategies and goals, adjusting the settings accordingly.
But how do I make use of this MA indicator? Find out below.
How to Use Moving Average
There are 3 ways in which traders use the MA:
- Trend determination
- Find Support and Resistance levels
- Determine crossovers
Trend Determination
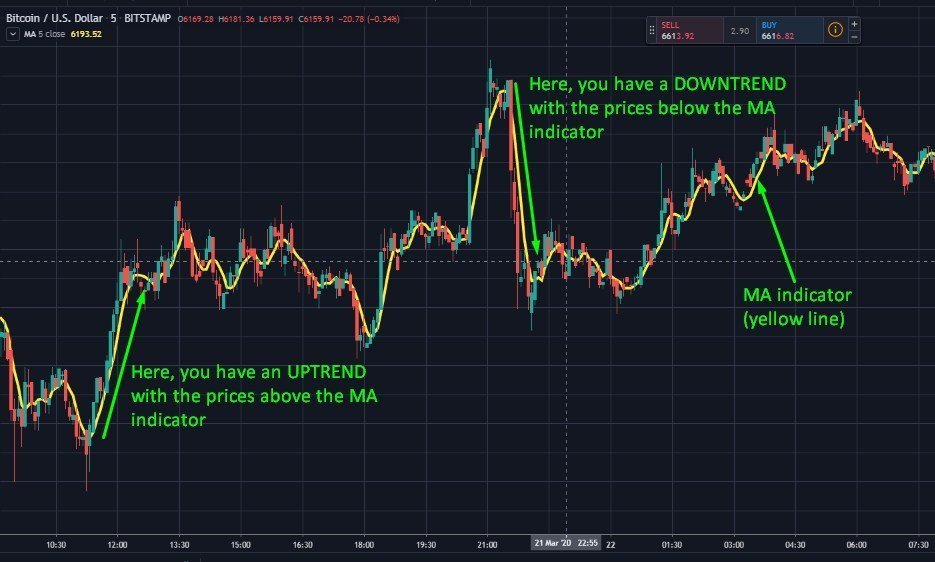
In trend determination, the MA adjusts with the prices.
When prices are trending higher, the MA also moves higher to reflect the increasing prices.
This could be said to be a bullish signal where traders may prefer buying opportunities.
But the opposite would be true if the price was consistently trading below the Moving Average indicator.
Here, the traders would prefer selling opportunities due to the market signalling a downward trend.
Find Support and Resistance Levels
The moving average can be used to determine support and resistance levels once a trader has placed a trade.
If traders see the MA trending higher, they may enter the market and if the trader is already long in an uptrend market, then the moving average can serve as the Stop Loss level.
The opposite is true for downtrends.

Determine Crossovers
MA uses a faster MA and a slower MA.
The faster MA is a short term MA like 5, 10 or 20 days period. It is considered a Short term MA as it considers prices over a short period and thus, moves faster.
But the slower MA is a long term MA like 50, 100, or 250 days period. Since it considers prices over a longer period of time, it is considered a Long term MA and thus, moves slowly.
A crossover signal is created when these different MAs intersect in a chart.
A bullish crossover (or a golden cross) happens when the short-term MA crosses above a long-term one. This suggests the beginning of an uptrend.
A bearish crossover (or death cross) happens when a short-term MA crosses below a long-term moving average. This indicates the start of a downtrend.

This meeting point is used either to enter or exit the market.
Having known the ways in which you can use the MA indicator, let’s see how to apply it while trading cryptos.
The details are below.
Trading Cryptos with the Moving Average Indicator
To use the Moving Average indicator while trading cryptos, you will follow these steps:
- Create an account or log in to a platform of your choice (for e.g tradingview.com)
- Click on ‘Chart’ to access the trade area.

- Choose the cryptocurrency of choice from the array of trade pairs available.

- Then select a time frame (minutes, hours, days, weeks, etc)

- With the trading area opened up, click on ‘Indicators’ at the top of the chart and select ‘MA’ from the dropdown menu
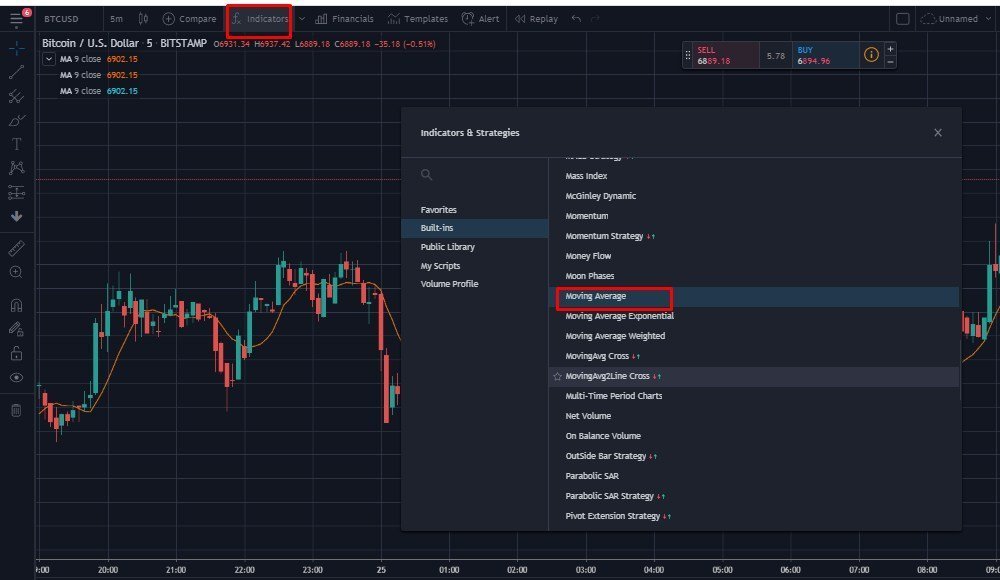
The indicator appears below the chart. You can adjust the size and colour of the elements. To add other MA lines on the same chart, still click on ‘Indicators’, select ‘Moving Average’ from the dropdown menu and adjust the settings to your period of choice.
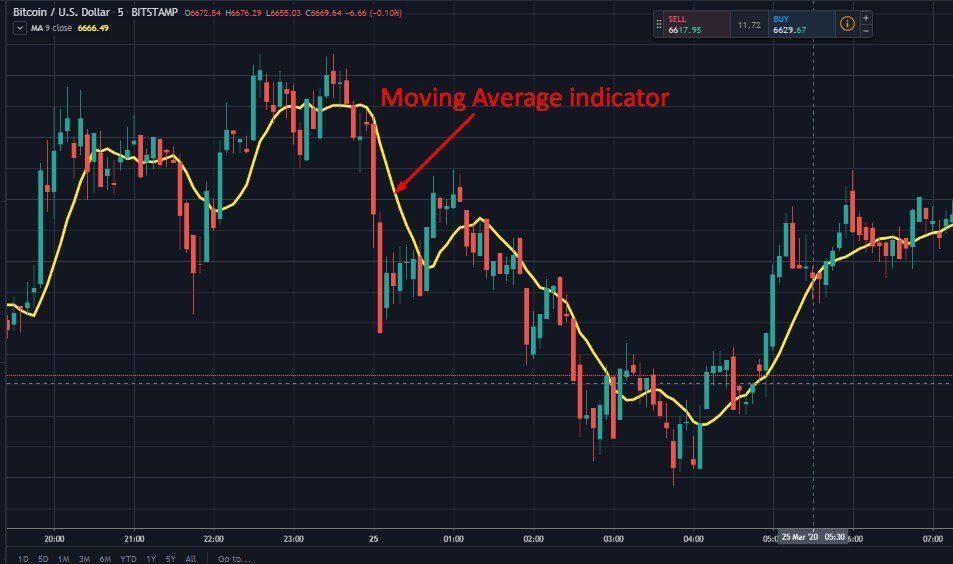
MA triggers buy/sell signals when the MA line goes below or above the price movements.
From these signals, a trader can deduce when to enter or leave a market.
You can also choose to trade using SMA or EMA by clicking on ‘Indicator’ and making your choice from the dropdown menu.
I will now go ahead to answer some of the questions usually asked about MA.
See you in the next section.
Frequently Asked Questions(FAQs)
Weighting the EMA( the Smoothing) is all about the EMA allocating more value to the most recent prices. Its formula is 2/n + 1 where n represents the number of periods.
For example, let’s look at the EMA of a 4-days period with prices of 1.5554, 1.5555, 1.5558, and 1.5560.
Using this formula(EMA = [Close – previous EMA] * (2 / n+1) + previous EMA), the EMA is calculated thus:
Day 4 – (1.5560 – 1.5558) x (2/4+1) + 1.5558 = 1.55588 weight, Day 3 – (1.5558 – 1.5555) x (2/4+1) + 1.5555 = 1.55562 weight and so on.
The charting platforms do all the EMA calculations for you so you don’t have to worry your pretty head on how to go about it. Just select the EMA from the indicators list and apply it to your chart. Go to the settings and adjust how many periods the indicator should calculate, such as 15, 50, or 100 periods.
1. Moving Average Convergence Divergence (MACD)
The MACD indicator is used to identify moving averages that are indicating a new trend, whether it’s bullish or bearish.
2. Bollinger Bands(BB)
The Bollinger Bands indicator helps traders to determine possible buy/sell points as well as when an asset might make a big move.
Moving Average is a powerful crypto trading indicator and is one of the most widely used. Its ability to analyze market trends helps a trader to deduce how a market is performing.
But its major downside is its lag time. Since MA is a lagging indicator that considers previous price action, its signals are often too late.
For example, a bullish crossover may suggest a buy, but it may only happen after a significant rise in price.
This means that even if the uptrend continues, you may have lost potential profit at some point between the rise in price and the crossover signal. Or worse still, a false golden cross signal might have led you to buy just before a significant price drop.
For this, I will say it depends on your trading style.
The EMA has greater agility and usually reacts faster to changes in general market sentiment and respective price action but the SMA reacts in a slower manner. Thus, the SMA better smooths out fakeouts and extraordinary price movement.
For a trader who uses smaller time frames and wants to catch the trend fast, the EMA is appropriate since it will enable you to recognize and enter the trend earlier. The downside of this is that since EMA reacts faster to the most recent price actions, it could give a wrong signal that the trend has already reversed. This causes the trader to exit the trade (probably at a loss) while the market may continue to move in the direction that will favour the trader.
[widget id=”custom_html-4″]
Learn How To Trade
If you want to learn how to trade cryptocurrencies profitably, sign up for free on Afibie.
You can join our Telegram channel, where we hold live sessions and give trade signals.
Closing Thoughts
The use of technical indicators has a simple goal: using the existing data to make more informed decisions that will likely lead to desired outcomes.
Moving Average(MA) helps smooth out price action by filtering out the “noise” from random short-term price fluctuations. This helps traders to determine when to enter or leave the market.
No single indicator is foolproof; combining indicators enhances performance
With this, I come to the end of today’s post.
I hope the concept of Moving Average is crystal clear to you now?
Have you used the MA indicator before? What was your experience?
Which of the MAs is your fave – SMA or EMA?
What other indicators do you combine MA with to trade profitably?
I look forward to seeing your replies in the comment section below.
Also, help to share this piece of information to help educate a brother. The share buttons are right below.

")

0 Comments