
Today’s post is all about Fibonacci Retracement a crypto trading indicator used in technical analysis.
Fibonacci Retracements are ratios identifying potential reversal levels.
These ratios are found in the Fibonacci sequence.
Fibonacci ratios define retracement levels and forecast the extent of a correction or pullback.
In this post, I will explain what Fibonacci Retracement is, its purpose, and how you can use it for profitable trading.
I explained most of the terms I used here in my ‘Crypto Trading Indicators‘ post(the #1in this Chart 101 series).
Let’s get to the day’s business.
Fibonacci Retracement Summary
- Brief History of Fibonacci Retracement
- How Are The Fibonacci Levels Gotten?
- Common Fibonacci Retracement Levels
- How to Draw the Fibonacci Retracement
- Fibonacci Retracement: FAQs
- Conclusion
A click on any subtopic displays the whole details therein.
Have a wonderful reading experience!
**Heads up!!
Today’s post is #2 in the Chart 101 series.
For a complete understanding of the series, read in this order:
- Crypto Trading Indicators – What are They?
- Fibonacci Retracement – Is It Reliable?
- Moving Average Convergence Divergence(MACD) – A Complete Analysis
- Bollinger Bands – How Good Is This Indicator?
- Relative Strength Index(RSI) – An In-depth Review
- The Moving Average(MA) Analyzed -A Complete Guide
- Engulfing Candlestick Pattern – How Does It Work?
Brief History of Fibonacci Retracement
Fibonacci(pronounced “FIB” + “uh” + “NAA” + “chee”) Retracement is a method that technical analysts use to identify the support and resistance level.
Fibonacci is one of the most famous names in mathematics and his real name is Leonardo Pisano.
Leonardo Pisano was the son of Guglielmo Bonaccio.
The name ‘Fibonacci’ came to be when scholars studying the copies of his script misinterpreted part of the title ‘Filius Bonacci’ which means ‘Son of Bonacci’ as his surname.
Fibonacci Retracement is a popular tool that technical traders use to help identify strategic spots for transactions, stop losses, or target prices to help traders get in at a good price.
It uses a horizontal line to indicate where you can possibly find support and resistance levels.
Every level is marked by a percentage which shows how much of the previous move the price has retraced.
The indicator does not have any formula.
When you apply the indicator to a chart, you can draw the lines between any 2 significant price points, like a high and a low.
Then the indicator will create the levels between those 2 points.
How Are The Fibonacci Levels Gotten?
Fibonacci Levels are derived from a number series that the Italian mathematician introduced to the West during the 13th century.
The sequence starts like this: 0, 1, 1, 2, 3, 5, 8, 13, 21, 34, 55, 89…
This sequence extends to infinity and contains many unique mathematical properties.
Each new number is the sum of the two numbers before it. Thus,
0 + 1 = 1
1 + 1 = 2
1 + 2 = 3
2 + 3 = 5
3 + 5 = 8
5 + 8= 13
8 + 13= 21, etc
As the sequence progresses, each number is:
- approximately 61.8% of the next number
- approximately 38.2% of the following number
- approximately 23.6% of the number after that
I will explain further below.
A number divided by the next highest number approximates 0.6180:
13 ÷ 21 = 0.6190
21 ÷ 34 = 0.6176
34 ÷ 55 = 0.6181
55 ÷ 89 = 0.6179 etc
The approximation nears 0.6180 as the numbers increase. This is the basis for the 61.8% retracement level.
Note that the 61.8% retracement level is rounded off to 62%.
A number divided by another two places higher approximates 0.3820:
13 ÷ 34 = 0.382
21 ÷ 55 = 0.3818
34 ÷ 89 = 0.3820
55 ÷ 144 = 0.3819 etc
The approximation nears 0.3820 as the numbers increase. This is the basis for the 38.2% retracement level.
Note that the 38.2% retracement level is rounded off to 38%. Also, note that 1 – 0.618 = 0.382.
A number divided by another three places higher approximates .2360:
13 ÷ 55 = 0.2363
21 ÷ 89 = 0.2359
34 ÷ 144 = 0.2361
55 ÷ 233 = 0.2361 etc
The approximation nears 0.2360 as the numbers increase. This is the basis for the 23.6% retracement level.
Common Fibonacci Retracement Levels
The common Fibonacci retracement levels are 23.6%, 38.2%, 50%, and 61.8%.
From the explanation above, it is clear that 23.6%, 38.2%, and 61.8% stem from ratios found within the Fibonacci sequence.
The 50% retracement is not based on a Fibonacci number. Instead, this number stems from Dow Theory’s assertion that the Averages often retrace half their prior move.
Based on depth, we can consider a 23.6% retracement to be relatively shallow.
Retracements in the 38.2%-50% range would be considered moderate.
The 61.8% retracement can be referred to as the golden retracement.
I will now explain how it works in the next section.
How to Draw the Fibonacci Retracement
In drawing the Fibonacci Retracement(Fib), you can go 2 ways. You can draw from left to right or you can go right to left.
For this explanation, I used the Tradingview platform.
To draw a Fib, you will follow these steps:
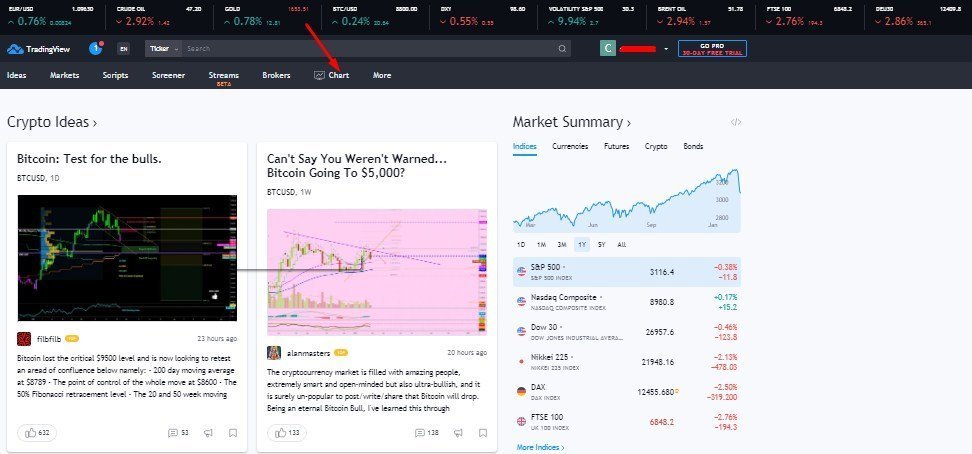
- Create an account or login(if you already own an account) to tradingview.com
- Then click on ‘Chart’ and it will take you to the trade area
- First of all, choose the time/period you will want to cover e.g 1 hour, 5 days, 3 months, etc.

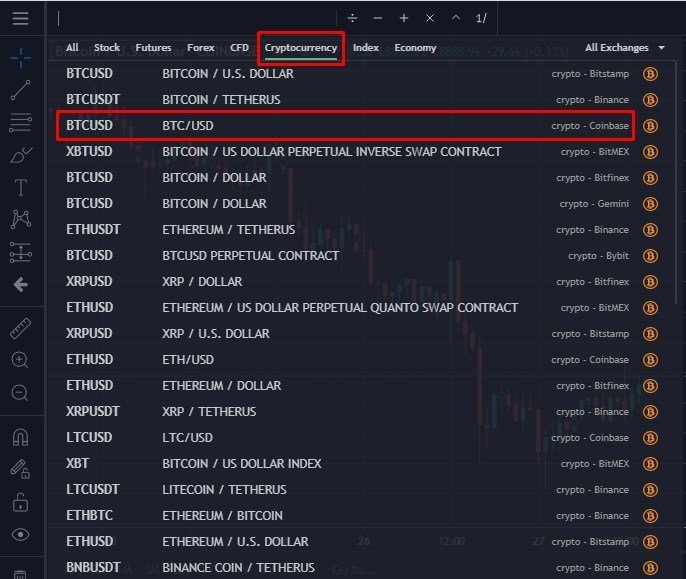
- Next, select the crypto pair (e.g BTC/USD) you will want to study. Click on the task bar and select ‘Cryptocurrency’. For my explanation, I chose BTC/USD on Coinbase.
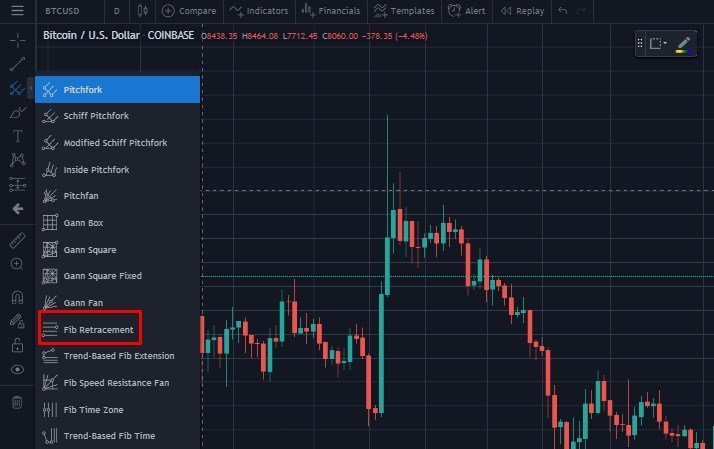
- Hover over the tools on the drawing panel located on the left hand side of the screen. Click on ‘Gann and Fibonacci tools’. From the drop-down menu, select ‘Fib Retracement’.
- Now place your cursor on the most recent top, hold and drag to a recent bottom. The levels are then displayed.
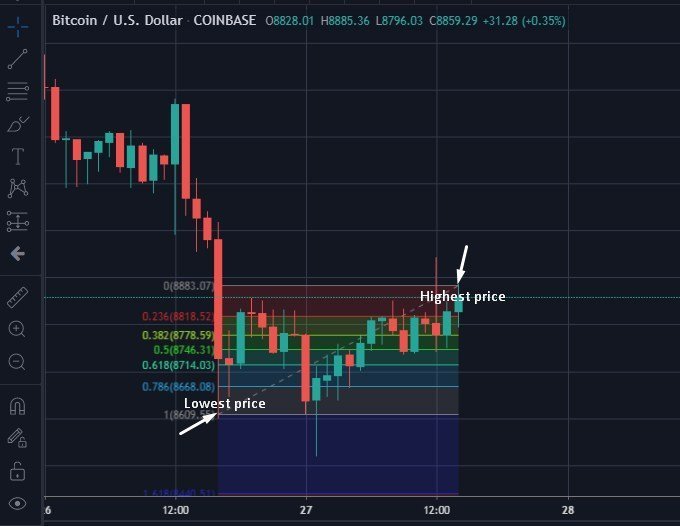
In using the Fib tool, it is advisable to pull it out at the point where an uptrend or downtrend ensues. When done, you can watch how the price fares at each level and know how to set your buy/sell limits.
You can set buy limits at 50% or 62% levels expecting a turnaround though in some cases, the price may still go down further to 100% (which will result in a total reversal).
Sell limits can be set at the 38% level as price dips up to that level (most times) before shooting up again.
Now in drawing the Fib, there are few things to note:
- Do not mix your Fib points i.e if you are taking your starting point from the wick of the candlestick, let the stopping point rest on the wick too, not on the body of the candlestick.
- Use the Fib tool having the bigger picture in mind; do take into cognizance the long term trends.
- Always combine the Fib tool with other indicators to get better results.
I answered some frequently asked questions about Fibonacci Retracement below.
Fibonacci Retracement: FAQs
What is the difference between Fibonacci Retracement and Fibonacci Extension?
Fibonacci extensions show where the price will go following a retracement while the retracement levels indicate how deep a retracement could be.
Fibonacci retracements are typically used to make a case for entering a trade, whereas Fibonacci extensions are typically used in determining where to take profits.
Does Fibonacci Retracement really work?
Fibonacci Retracement is not foolproof and thus, fails at some point.
Sometimes, prices may reverse to the 38% level or may hit the 50% or 62% level before turning around.
Again, determining which Swing Low and Swing High to use becomes an issue.
Since there is no laid down formula for that, it will now depend on the perception of the trader(which differs from one person to another).
This is the main reason why you need to hone your skills and combine the Fibonacci retracement tool with other tools to help give you a higher probability of success.
What other indicators can work with Fibonacci Retracement?
Some other indicators that you can use Fibonacci Retracement with include Bollinger Bands, Moving Average, Moving Average Convergence and Divergence(MACD), etc.
[widget id=”custom_html-4″]
Learn How To Trade
If you want to learn how to trade cryptocurrencies profitably, sign up for free on Afibie.
You can join our Telegram channel, where we hold live sessions and give trade signals.
Conclusion
Trading with Fibonacci retracement is profitable and requires proper practice.
It is a wonderful tool but should not be used alone.
With that, I come to the end of today’s discussion. I hope it was worth your while?
So after reading through, do you have any questions to ask me?
Do you use this tool and what was your experience using it?
What other tool are you going to add to Fibonacci Retracement to trade profitably?
Let me know your answers in the comment section below.
And as usual, our last task: Share this post by clicking on the buttons below. Help someone trade profitably!

")

0 Comments