
Today’s post covers an explanation of crypto trading indicators and their uses.
In cryptocurrency trading, traders make use of some trade indicators to analyze the market before going ahead to trade.
Traders use crypto trading indicators to identify signals and trends in the market.
In carrying out technical analysis, traders use them to determine both the long and short-term direction of the price of an asset.
After reading through today’s post, you will fully understand the purpose and use of trade indicators.
Now, don’t get yourself all worked up yet on how to understand the trading terminologies; I took my time to explain them.
So without further ado, let’s get down to the business of the day.
Post Summary
Before I start up the discussion properly, let me list out the mini topics that will spearhead our discussion. They include:
- Definition of Terms
- What are Crypto Trading Indicators?
- Top Crypto Trading Indicators
- What to Know Before Using These Indicators
- Conclusion
Click on any of them to easily view the contents.
**Heads up!!
Today’s post is #1 in the Chart 101 series.
For a complete understanding of the series, read in this order:
- Crypto Trading Indicators – What are They Used For?
- Fibonacci Retracement – Is It Reliable?
- Moving Average Convergence Divergence(MACD) – A Complete Analysis
- Bollinger Bands – How Good Is This Indicator?
- Relative Strength Index(RSI) – An In-depth Review
- The Moving Average(MA) Analyzed -A Complete Guide
- Engulfing Candlestick Pattern – How Does It Work?
Definition of Terms
As I promised, I define some trade terms that I will use later in the post. This is to ensure that we will all flow together. Some of the terms include:
Retracement

A retracement is a temporary price movement against the prevailing trend, followed by a resumption of the original trend.
Reversal

A reversal refers to the change in the price direction of an asset. It can occur to the upside or downside. Following an uptrend, a reversal would be to the downside while with a downtrend, it would be to the upside. Reversals occur in different time frames and are relevant to different traders. For e.g: A 5-minute chart matters not to a long-term investor who is watching for a reversal on daily or weekly charts. But the 5-minute reversal is very important to a day trader.
Support
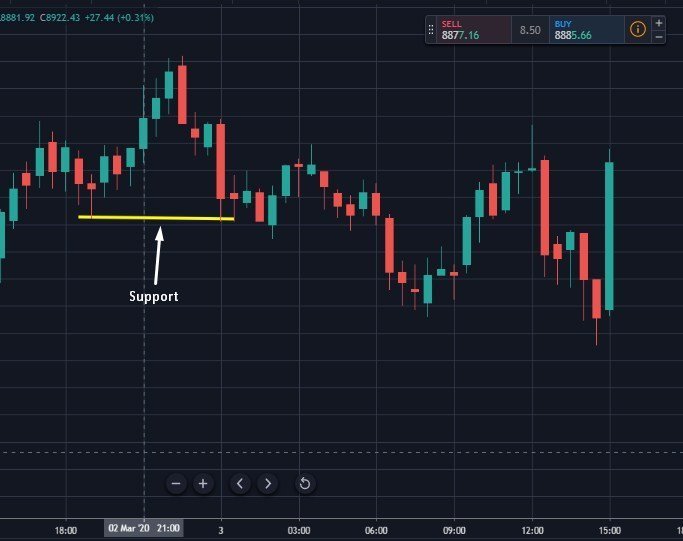
Support or the Support level is the price level that an asset does not fall below for a period of time.
Buyers entering the market to purchase an asset when the price dips create the support level.
This means that the price is more likely to “bounce” off this level rather than break through it. However, once the price has breached this level, it will most likely dip more till it meets another Support level.
Technical analysts identify support levels by drawing a line along the lowest lows for the period being considered. The line can be flat or slanted up or down depending on the overall price trend.
Resistance
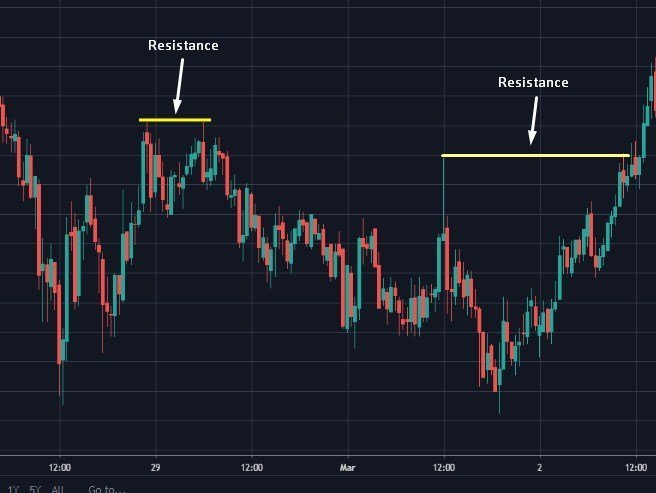
Resistance or the Resistance level is the opposite of the Support level. This is the price level that an asset does not rise above for a period of time.
It is created by the appearance of a growing number of sellers willing to sell their assets when the price rises. Again, this means that the price is more likely to “bounce” off this level rather than break through it.
But if it eventually does, it is likely to keep rising until it meets another Resistance level.
Technical analysts identify resistance levels by drawing a line along the highest highs for the period being considered. Depending on price action, this line can be flat or slanted.
NB: Support and Resistance can be identified using 2 simple methods:
- Swing Highs and Lows – I explained this below.
- Psychological Levels – Occurs when the price ends with multiples of zero. The most common psych levels involve prices having two zeros at the end, more powerful than that would be psych levels ending in three zeros, and most powerful psych levels of all are those of four zeros at the end.


Uptrend

Uptrend refers to the price movement of a financial asset when the overall direction is upward. For an uptrend, each successive peak(the highest point) and trough(a depression in the trend) tends to be higher than the ones found earlier in the trend. Thus, it is composed of higher swing lows and higher swing highs.
Downtrend

A downtrend refers to the price movement of a financial asset when the overall direction is downward. Downtrends are mainly characterized by lower peaks and lower troughs over time.
Swing High

Swing high is used in technical analysis. It refers to a peak reached by an asset’s price before a decline. A swing high forms when a particular high reached is greater than a given number of highs positioned around it. A sequence of consecutively higher swing highs indicates that the given asset is in an uptrend.
Swing Low

Swing low refers to the troughs reached by the price of an asset during a given period of time. This is usually less than 20 trading periods. A swing low forms when a low is lower than any other surrounding prices in a given period of time. A series of consecutively lower swing lows indicates that the given asset is in a downtrend.
Top
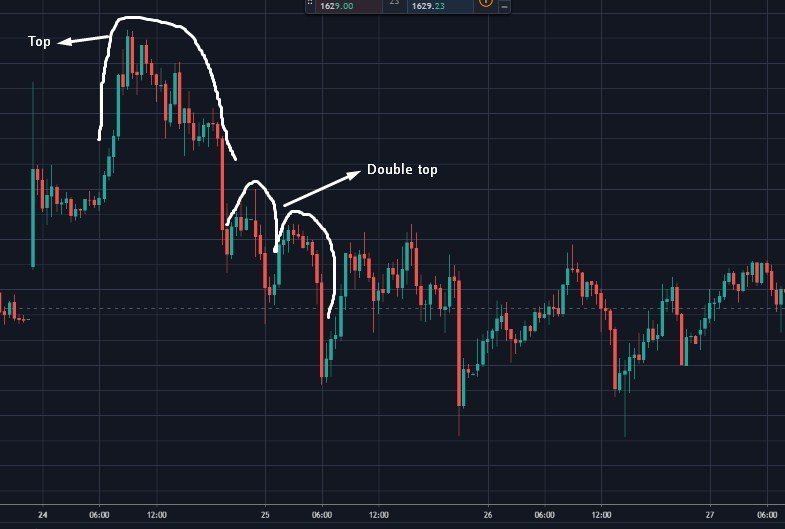
The top formation is a technical analysis pattern that often occurs at market tops and can signal the reversal of an uptrend. A double top has an ‘M’ shape and indicates a bearish reversal in trend.
Bottom
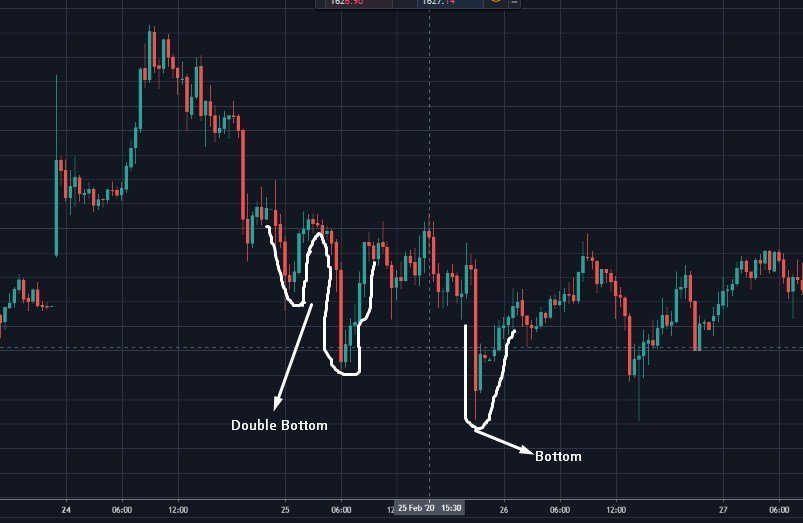
Technical analysts identify a bottom as a chart pattern characterized by a series of price movements. A double bottom has a ‘W’ shape and is a signal for a bullish price movement.
Correction/Pullback
A correction is a decline of 10% or greater in the price of an asset. Price corrections are common in the world of investments.
A correction suggests that the price was over-inflated and the asset over-valued and, as such, the asset is rediscovering its market price.
Pullbacks are just the way the assets try to cover up for their corrections. Having defined some of these crypto trading techies, let’s now discuss what trading indicators are all about.
What are Crypto Trading Indicators?
In trading cryptos, traders carry out technical analysis before going on to trade. This is owing to the claim that through these careful analyses, patterns can be identified and outcomes predicted.
These analyses are carried out using Crypto Trading Indicators.
Crypto Trading Indicators/Technical Indicators are mathematical calculations based on an asset’s price and/or volume.
These indicators are plotted as lines on the price chart and can help traders identify certain signals and trends in the market.
They are simply chart-analysis tools that help traders understand the price movement of an asset better and know when to trade or withdraw.
Technical indicators are a fundamental part of technical analyses.
There have been many technical indicators developed and more new variants continue to be developed by traders with the aim of getting better results.
These new indicators are backtested on historic price and volume data to discover how effective they would have been in forecasting future events.
They have always been used in trading not just cryptos, but even in Forex trading too.
There is a huge range of technical analysis tools available that analyze trends, provide price averages, measure volatility and more.
I discussed some of them in the next section.
Read on to find out.
Top Crypto Trading/Technical Indicators
There are a number of technical analysis tools available.
They perform the function of analyzing trends, providing price averages, measuring volatility, etc.
For clarity’s sake, I classified the indicators into 4 main categories based on the specific functions they perform/what they are used to determine. The categories include:
- support/resistance
- trend following
- volatility
- oscillators
I explained each category and listed the indicators that perform the particular function below.
Support/Resistance Indicators
Support/Resistance level is very vital in technical analysis. The concepts refer to the price levels on charts that form barriers to an asset’s price being pushed in a given direction. Here are some of the indicators used in determining the Support/Resistance level:
1. Fibonacci Retracement
Fibonacci Retracement is a trading indicator that is used to identify potential reversal levels.
Crypto traders who feel the market is about to make a move often use Fibonacci retracement to confirm this.
This is simply because it helps them to identify possible levels of support and resistance, which could indicate an uptrend or a downtrend.
With the level of support/resistance identified, traders can decide when to open or close their positions.
Fibonacci retracement levels are 23.6%(shallow), 38.2%(moderate), and 61.8%(golden). There’s also the 50% retracement that is not based on a Fibonacci number.
Read more on Fibonacci Retracement here.
2. Pivot Point
This is a price level that is used by traders as a possible indicator of market movement.
A Pivot Point is calculated as an average of significant prices (high, low, close) from the performance of a market in the preceding trading period.
Traders use these lines as potential support and resistance levels; levels that the price might have a difficult time breaking through.
If, for the following period, the market trades above the pivot point, it is usually evaluated as bullish whereas trading below the pivot point is seen as bearish.
Other indicators are DonChain Channels, Camarilla, Wolfe Wave, etc.
Trend-Following Indicators
Trend-following indicators were created to help traders to trade crypto pairs that are trending up or down.
They help to point out the direction of the trend and can tell if a trend really exists or not. Some of the indicators that do this include:
1. Moving Average (MA)
A Moving Average (MA) is a technical tool that averages a crypto pair’s price over a period of time. The effect that this has on the chart helps give a clearer indication of what direction the pair is moving(up, down, or sideways). There is a variety of MAs to choose from but the Simple Moving Averages(SMA) and Exponential Moving Averages(EMA) are the most popular.
Learn more about Moving Average(MA) here.
2. Ichimoku Kinko Hyo
This is a complicated-looking trend assistant that is simpler than it appears.
Ichimoku Kinko Hyo (shortened to just ‘Ichimoku’) translates to one one-glance equilibrium chart or instant look at the balance chart.
It is sometimes referred to as a “one glance cloud chart” based on the unique “clouds” that feature in Ichimoku charting.
Ichimoku was created to be a stand-alone indicator that:
- shows the current trends
- displays support/resistance levels
- indicate when a trend has likely reversed
3. MACD
MACD is an acronym for Moving Average Convergence Divergence.
The MACD indicator is used to identify moving averages that are indicating a new trend, whether it’s bullish or bearish.
MACD calculates 2 moving averages – the slower and the faster one. When the 2 moving averages separate and the histogram gets bigger, it is called Divergence.
This is because the faster-moving average is “diverging” or moving away from the slower moving average.
As the moving averages get closer to each other, the histogram gets smaller and is called Convergence.
This is because the faster moving average is “converging” or getting closer to the slower moving average.
4. Average Directional Index
This indicator will not show you whether the price is trending up or down.
It will only indicate if the price is trending or is ranging.
This makes this indicator an apt filter for either a range or trend strategy by ensuring that you are trading based on current market conditions.
Other trend-following indicators include On Balance Volume(OBV), etc.
Volatility Indicators
Volatility measures how large the swing ups and swing downs are for a particular currency pair. If an asset’s price fluctuates wildly up and down, it is said to have high volatility.
But if a currency pair’s price does not fluctuate that much, it is said to have low volatility.
It’s important that you know how volatile a currency pair is before opening a trade.
This is because you need to take cognizance of that before picking your trade size and stop and limit levels. Some indicators that help you do that are:
1. Bollinger Bands
What are Billinger Bands?
A Bollinger Band is a volatility primarily based indicator, developed by John Bollinger.
They are composed of 3 lines: a simple moving average (middle band), a higher, and a lower band.
These bands move with the market price, widening or narrowing as volatility increases or decreases severally.
However, the position of the bands and the way the price acts in relevance to the bands provides data concerning:
- how robust the trend is
- potential bottom or topping signals
2. Average True Range (ATR)
The ATR indicator is mainly used to measure the intensity of market volatility, that is, the indicator to show the market change rate.
It is displayed with a decimal to indicate the number of percentage in points(pips) between the period highs and lows.
This indicator is mainly used to measure price fluctuations.
It is important that a trader knows this because as volatility increases, so will a chart’s ATR value.
Oscillators
These indicators give traders an idea of how momentum is developing on specific currency pairs.
When the price goes higher, oscillators will move higher and when the price drops lower, oscillators will move lower.
If oscillators reach an extreme level, it might be time to look for the price to turn back around to the mean.
However, just because an oscillator reaches ‘Overbought’ or ‘Oversold’ levels doesn’t mean you should try to call it a top or a bottom.
And also, oscillators can stay at extreme levels for a long time; so you will need to wait for a valid sign before trading.
Indicators under this category are:
1. Relative Strength Indicator(RSI)
The RSI is a popular indicator developed by a technical analyst named J. Welles Wilder. It points out the overbought and oversold conditions and also helps to confirm a trend.
The Relative Strength Index is arguably the most popular oscillator to use.
It works like a regular pendulum or alternating waves. It moves to and fro, or back and forth between 0 and 100.
The RSI is considered overbought above 70 and oversold when below 30.
Traders generally look to sell when 70 is crossed from above and look to buy when 30 is crossed from below.
Click here to learn more about RSI and how it works.
2. Stochastics Indicator
It is a momentum indicator that uses support and resistance levels. Dr. George Lane developed this indicator in the late 1950s.
The term stochastic refers to the point of a current price in relation to its price range over a period of time.
This method attempts to predict price turning points by comparing the closing price of a security to its price range.
3. Commodity Channel Index(CCI) Indicator
The CCI differs from oscillators in that there is no limit to how high or how low it can go.
CCI uses 0 as a centerline with overbought and oversold levels starting at +100 and -100.
Crypto traders look to sell breaks below +100 and buy breaks above -100.
After listing out the top indicators, I provided a few tidbits of information that you should be aware of before proceeding to use any of the above-listed indicators.
Read them up below.
What to Know Before Using These Indicators
- First of all, know that indicators do not guarantee a profit. It only helps you to identify trends and signals in the market.
- Never use an indicator alone as they do not do so well on their own. Create your own combination of indicators and find out what works for you.
- In the same vein, do not use too many indicators all at once. Select the ones that align with your investment objectives.
- Carry out more research on any chosen indicator to find out the best ways to put it to use.
- Test run each indicator before using it to carry out live trades.
- Always confirm signals using different tools and time frames.
- Focus on your trading plan even when using indicators
- Default parameters on indicators might not be the best for the asset you are dealing with. You can change or tweak the parameters to suit your asset.
Unfortunately, there is no holy grail to crypto trading. What works for Trader A might not work for Trader B.
Each trader has to develop a distinctive trade style by learning about the variety of analysis tools available.
Then from the results garnered, trading strategies can be set up.
Know that the information contained herein is for educational purposes. It should not be seen as financial advice. Seek the help of a financial advisor if you need some financial help.
Learn How To Trade
If you want to learn how to trade cryptocurrencies profitably, sign up for free on Afibie.
You can join our Telegram channel, where we hold live sessions and give trade signals.
Conclusion
This brings us to the end of today’s discussion.
I am sure by now, you’ve come to understand the essence of these trading indicators and the particular function of each.
So, from your knowledge of trading indicators so far, I believe you can help to provide answers to the questions below:
Do you use any of these trading indicators while trading cryptos? Share your experience with me.
Which indicators make up your best combo?
Is there something you will need me to elaborate more on?
Leave your replies in the comment section below. I will be checking back for them.
Do share this post with others using the share buttons right below.

")

0 Comments