
Moving Average or MA is an indicator that helps to smoothen out price movement on the chart. The name came about from how it works. It takes the average closing price of a predetermined number of period. The higher the predetermined period value, the smoother and less reactive is the moving average.
Moving averages can tell you if a market is trending up or down, ranging or even act as support and resistance.
I hope you were able to apply my previous lesson – Understanding and Trading with RSI. MA is another tool to sharpen your trading skill
There are basically two types of MA.
Simple Moving Average
Exponential Moving Average
Simple Moving Average
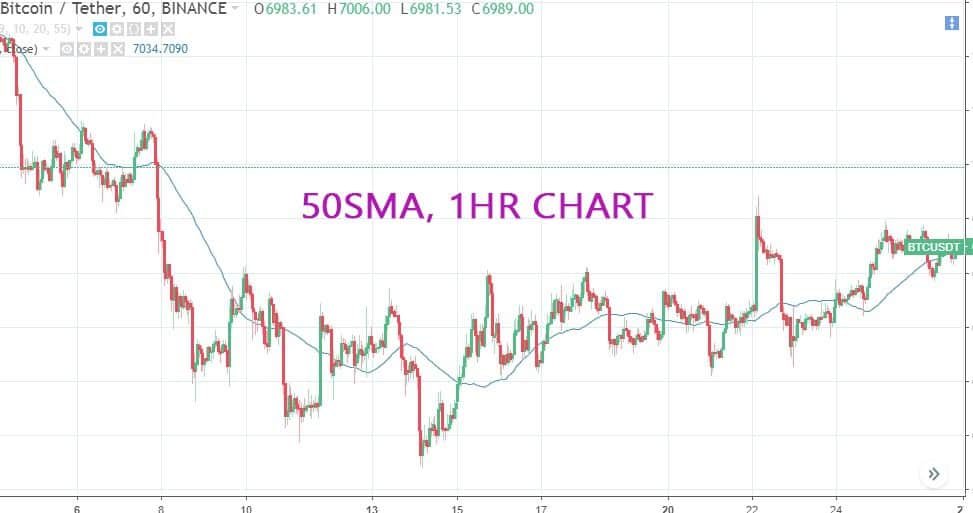
A simple moving average (SMA) is the simplest type of moving average in chart analysis.
Basically, a simple moving average is calculated by adding up the last “Y” period’s closing prices and then dividing that number by Y.
If you plotted a 50 period simple moving average on a 1-hour chart, you would add up the closing prices for the last 50 hours, and then divide that number by 10. Do this continuously and couple those average prices together and you get a moving average!
Another example could be a 5-period simple moving average on a 15-minute currency chart, you would add up the closing prices of the last 75 minutes and then divide that number by 5.
It’s important to know how it works so you can know how to tweak and adjust the indicator to your trading strategy.
Exponential Moving Average
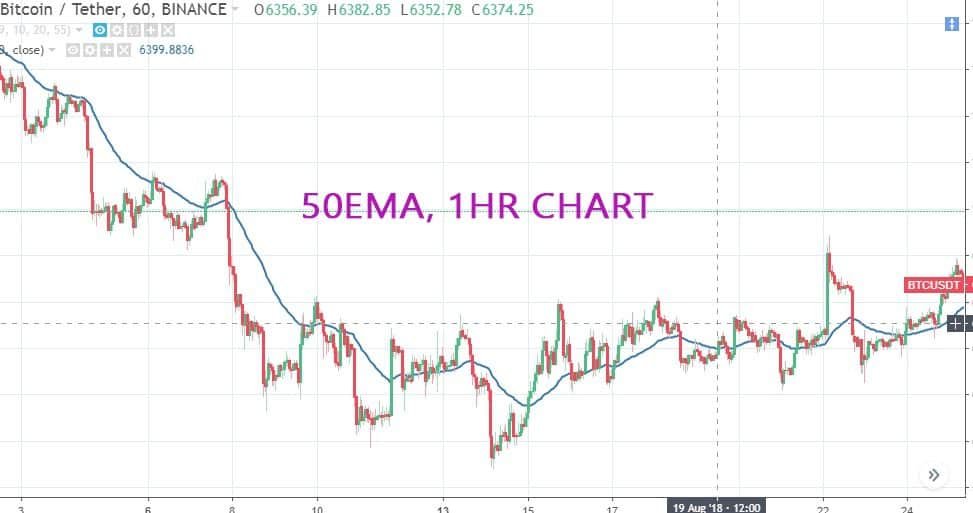
Exponential moving averages respond faster to price movements than the simple moving averages. It basically shows you what is happening in the market presently rather than what happened some few days or months ago.
The downside to using the exponential moving average is that you might get faked out during consolidation periods (oh no!).
Because the moving average responds so quickly to the price, you might think a trend is forming when it could just be a price spike. This would be a case of the indicator being too fast for your own good.
With a simple moving average, the opposite is true.
When you want a moving average that is smoother and slower to respond to price action, then a longer period SMA is the best way to go.
This would work well when looking at longer time frames, as it could give you an idea of the overall trend.
How to Use Moving Average to Find Trends
Moving Averages on their own cannot predict a trend else when used with one another.
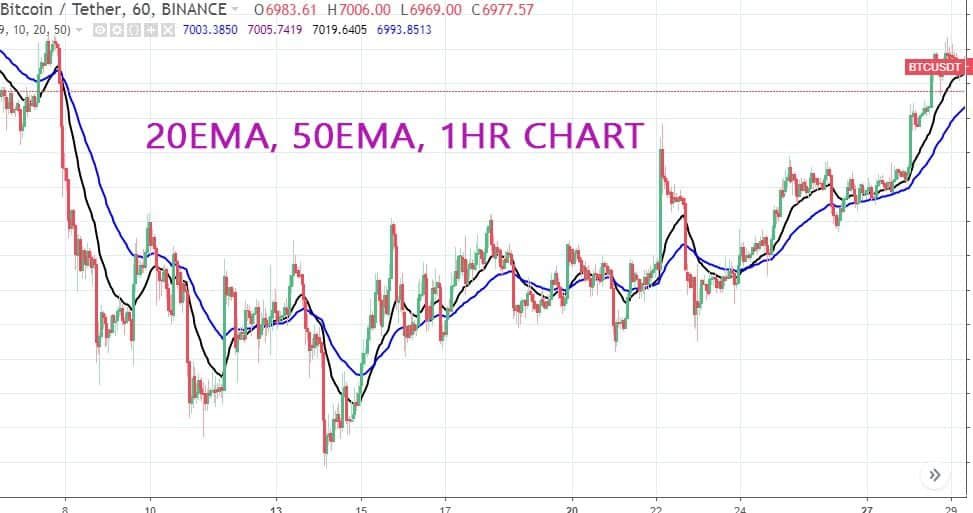
You will notice that despite the fake-out (drop) of the candlesticks yet the 20 SMA is still above the 50SMA. This signifies that the uptrend is still valid. Such fake outs are caused by the sudden reaction of traders to the news after which the regular trend continues.
You really need a lot of stamina when trading combos so you don’t stagger at every news. Following the moving average trend is paramount.
How Moving Average Show Support and Resistance
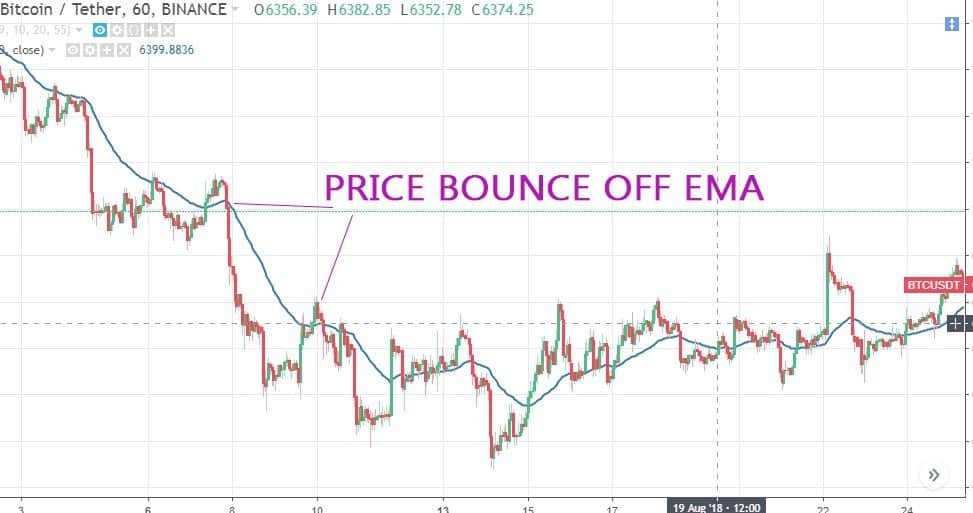
From the above picture, you will notice how the price bounces off the moving averages.
But you should also know that they can break, just like any support and resistance level!
[widget id=”custom_html-4″]

")

0 Comments