")
In today’s post(#3 in the Chart 101 series), you will be learning about the Moving Average Convergence Divergence(MACD).
The MACD indicator is one of the most popular crypto trading indicators.
Traders use this indicator to identify moving averages that signal a new trend, whether it’s bullish or bearish.
It calculates 2 moving averages – the slower and the faster one.
By the time you finish reading this post, you will grasp the essence of MACD, its applications, and its usage.
I will be starting up the discussion in a jiffy so just get your writing tools ready to jot down points.
Ready to go? Just follow up closely as I take you through this informative session.
Post Summary
To enable me to walk you through this post smoothly, these are the main points that will steer the discussion of today:
A click on any of the points opens up its details.
Let’s get down to the discussion of the afore-listed points.
**Heads up!!
Today’s post is #3 in the Chart 101 series.
For a complete understanding of the series, read in this order:
- Crypto Trading Indicators – What are They?
- Fibonacci Retracement – Is It Reliable?
- Moving Average Convergence Divergence(MACD) – A Complete Analysis
- Bollinger Bands – How Good Is This Indicator?
- Relative Strength Index(RSI) – An In-depth Review
- The Moving Average(MA) Analyzed -A Complete Guide
- Engulfing Candlestick Pattern – How Does It Work?
What is MACD?
MACD is an acronym for Moving Average Convergence Divergence.
The MACD indicator is used to identify moving averages that indicate a new trend, whether it’s bullish or bearish.
Gerald B. Appel developed in the late 1970s as a tool that utilizes moving averages to determine the momentum of an asset.
Then Thomas Aspray added a histogram to the MACD in 1986 as a means to anticipate MACD crossovers.
Now I’m going to take a detour to explain the concept of Moving Average.
Moving Average is a line that represents the average value of previous data over a predetermined period of time. It can be divided into 2 different types:
- Simple Moving Average (SMA) – Assigns an equal value to all previous data.
- Exponential Moving Average (EMA) – Accords more importance to the more recent values.
The MACD indicator has 3 elements:
- The MACD line – This is used to calculate upward and downward momentum by measuring the gap between 2 EMAs. The 26-period EMA is usually subtracted from the 12-period EMA.
- The Signal line – This is usually a 9-period EMA of the MACD line i.e a 9 hour EMA on an hourly chart, a 9-day EMA on a daily chart, etc.
- A Histogram – The histogram is a graphical representation that is calculated based on the differences between the other 2 lines(MACD and Signal lines). It is represented with a bar graph(instead of a line); making it easier to read and interpret.
Let’s go ahead and look at how it works.
How Does MACD Work?
As the name implies, it tracks the differences between moving averages.
The correlation between the lines can be described as:
- Convergent(when the lines gravitate towards one another)
- Divergent(when the lines are moving apart)
The relevant signals of the MACD indicator are related to the crossovers which happen when the MACD line crosses above or below the centre line or above or below the Signal line.
The indicator works as follows:
- When the MACD line crosses above zero, it is considered bullish while crossing below zero is bearish.
- When the MACD line turns up from below zero, it is considered bullish while from above it is considered bearish.
- When the MACD line crosses from below to above the signal line, the indicator is considered bullish. The further below the zero-line it goes, the stronger the signal.
- When the MACD line crosses from above to below the signal line, the indicator is considered bearish. The further above the zero-line it goes, the stronger the signal.
In the next section, I will be showing you how to trade using this indicator.
Keep reading.
How to Trade Using MACD
Traders recognize 3 meaningful signals generated by this indicator:
- when the MACD line crosses the signal line
- when the MACD line crosses zero
- when there is a divergence between the MACD line and the price of the stock or between the histogram and the price of the asset
To use this indicator, you will follow these steps:
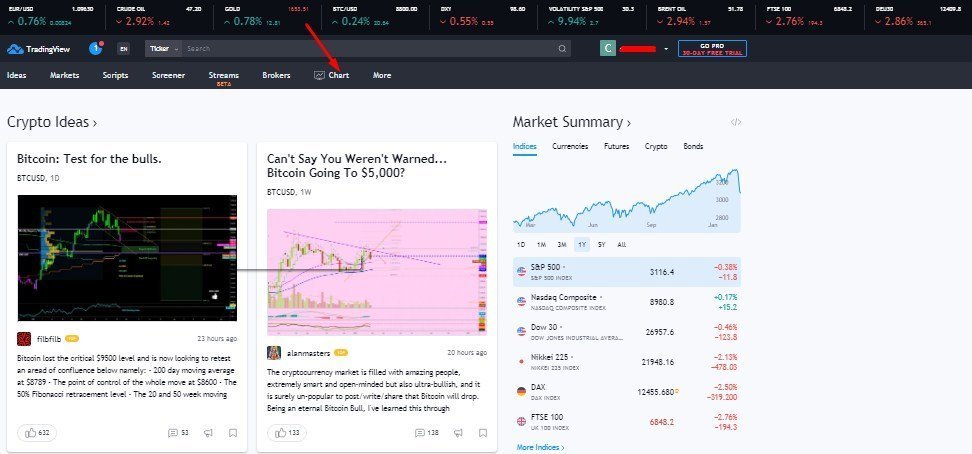
- Create an account or log in to a platform of your choice (for e.g tradingview.com)
- Click on ‘Chart’ to access the trade area.
- Select the cryptocurrency of choice
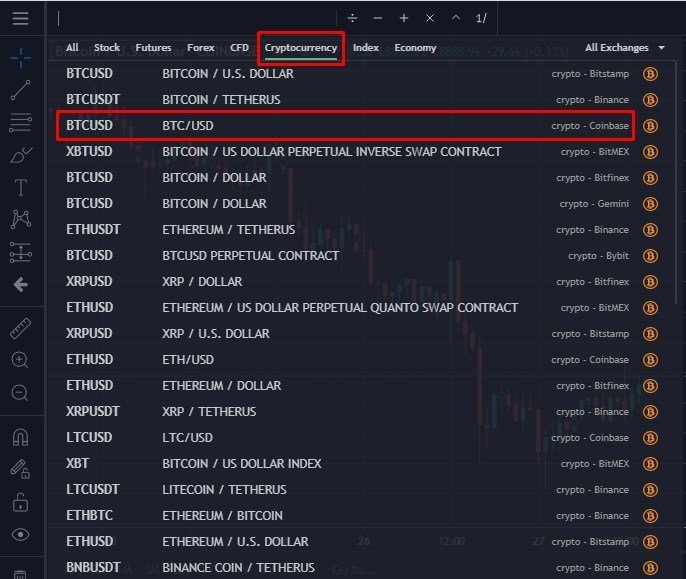
- Select a time frame (minutes, hours, days, weeks, etc)

- Click on ‘Indicators’ at the top of the chart and select ‘MACD’ from the dropdown menu

- The indicator is then displayed below the chart. You can adjust the size and colour of the elements

MACD triggers technical signals when it crosses above (to buy) or below (to sell) its signal line.
Using these signals, a trader can deduce when to enter or leave a trade.
I answered some of the frequently asked questions in the next section.
Read on.
Frequently Asked Questions(FAQs)
MACD is one of the most popular and efficient technical indicators. It’s trend-following and momentum-forecasting abilities are not flooded by complexities.
This makes it accessible to both novice and experienced traders and allows for easier interpretation and confirmation.
But bearing in mind that the MACD line crosses the centre or signal line at various points, it gives out a lot of fake signals and hence, should not be used alone.
Other good indicators to combine with it include:
1. Relative Strength Index(RSI)
2. Stochastic Oscillator
3. Average Directional Volume, etc
Well… the thing is: There is none!
There is no such thing as the best MACD settings because the market is always changing.
What works best right now is not likely to work the same in future.
So, the important thing is not to optimize for the best MACD indicator settings; rather, you should understand the concept behind it so you can use it to meet your trading needs.
[widget id=”custom_html-4″]
Learn How To Trade
If you want to learn how to trade cryptocurrencies profitably, sign up for free on Afibie.
You can join our Telegram channel, where we hold live sessions and give trade signals.
Conclusion
MACD helps investors understand whether the bullish or bearish movement in the price is strengthening or weakening.
But then, you have to understand that no technical tool can forecast with certainty. No trading system can either guarantee profits or eliminate risks.
The MACD has many strengths, but it is not incapable of error. Always use other technical tools to confirm signals produced by the MACD indicator.
And that, dear reader, brings us to the end of today’s discussion!
Hope I was able to clear the air about the MACD indicator?
Have you ever used the MACD indicator? What was your experience?
Personally, what other indicators do you think will be the best fit for you to use it with?
In the course of reading through, did you encounter any questions you will want to ask?
Leave your replies and the questions(if any) for me in the comment section below.
Help to share this post for sharing is caring. The share buttons are right below.

")

0 Comments