")
Every cryptocurrency investor wants to see the price of Bitcoin soar.
And as soon as the price rises a little, they all rush to buy so as not to miss out.
However, they fail to ask this question: Could it be a Bull trap?
A Bull trap is when a strong upward price trend reverses to a downward price trend shortly after.
I assume you must have experienced it, right?
So, in today’s post, I will tell you everything you need to know about the Bull trap and how to avoid it.
Post Summary
This is what I will cover:
- What is A Bull Trap?
- How Does A Bull Trap Work?
- What Causes A Bull Trap?
- How To Spot A Bull Trap And Profit From It
- Conclusion
Let’s get started!
1. What is A Bull Trap?
As already explained, a bull trap is a reversal in an asset’s price from an upward trend to a sudden downward trend.
To put it another way, it is an uptrend in a bear market, that creates a bullish sentiment.
However, moments later, the market will bottom in a downward direction unexpectedly.
In a “bull trap,” the price uptrend is short-lived. But it creates an excitement that compels traders to jump into the market, thinking it is the start of a new uptrend.
And when the market reverses, traders who have entered the market suffer significant, unforeseen losses.
Other names for a bull trap include “Dead Cat Bounce” and “Whipsaw patterns”.
Bull traps are common during times of market uncertainty or in the bear season.
While most traders, especially newbies, incur big losses as a result of bull traps, some traders profit from them.
As we progress, I will show you how to spot and avoid a bull trap and maybe even profit from it.
2. How Does A Bull Trap Work?
Let’s start with an example:
Assume that the price of BTC breaks out from a price zone of $17,000 to $21,000.
You see this as a great move and decide to enter the market and potentially make a quick buck.
But soon after, BTC dropped to $20,000 and started to trend downward.
That’s sad, right? Well, it happened because you got caught up in a bull trap.
I will explain further using the image below!
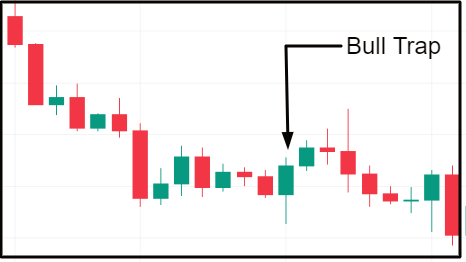
As shown in the above image:
After a long downward price spiral, the market tends to start correcting at some point.
Usually, it starts consolidating into a ranging market.
A ranging market is a type of market that is neither bullish nor bearish.
However, what happens under the hood is that the bulls and the bears get embroiled in a battle to dominate the market and drive the price in their favor.
So, this is how a bull trap happens:
As the battle unfolds, the bears will pull the market lower within the market range, setting a new low.
When this happens, the bulls push back more forcefully, which causes the market to rise.
Unsuspecting traders may interpret this as the dawn of a bullish trend and begin to accumulate assets in the market.
However, these traders face huge losses because the bears soon take over the market, sending it into a downward spiral.
Now, what causes a “bull trap”? You may ask. Go over to the next section and we will talk about it.
3. What Causes Bull Trap?
It is not exactly explicit. But we can identify a few factors:
– The Dip Buyers
Whenever the bear market sets in, investors are encouraged to buy the dip.
So, when these dip buyers step into the market and begin to accumulate some coins, the market starts to rise.
As a result, more investors are encouraged to buy, driving up the price even further.
Unluckily, other traders take advantage of this and start to sell their holdings for a profit, sending the market back into a downward spiral.
– Weak Buying Volume
Weak buying volume eventually results in a downward trend.
It indicates that the bulls were unable to sustain the trend and were thus dominated by the bears.
– FOMO (Fear of missing out)
Typically, it happens to traders who trade with emotion.
FOMO traders perceive every bullish move as an opportunity to buy.
So, as they rush to the market to buy, it creates a false indication of an upward trend in the market.
That is it for this section.
I am sure you do not want to get caught in a bull trap. That is why, in the next section, I will share how to spot a bull trap.
Continue reading!
4. How To Spot A Bull Trap And Profit From It
The truth is, it is always tough to identify a bull trap.
However, you can easily spot it if you conduct a careful fundamental and technical analysis.
What you want to look out for in your analysis includes:
(i) Fundamental Indicators
– Absence of Increased Volume
Volume trading is an excellent indicator that the market is about to enter an uptrend.
The reason is simple: A surge in volume suggests that demand is on the increase, therefore an uptrend.
If there is little or no noticeable increase in volume on the breakout, it’s a sign that it is a bull trap.
– Breaking Resistant Level
Another sign of a bull trap is a noticeable price increase that quickly reverses as soon as it hits a resistance level.
So, if the price does not surge above a resistance level, then it is possibly a downtrend or a continuation of a ranging market.
A resistance level represents a price point that an asset has had trouble exceeding in the time period being considered
https://www.investopedia.com/terms/r/resistance.asp
– A Sudden Break Out
Usually, in a bull trap, a sizable bullish candle will be seen next to a red candle, building up momentum within a daily time frame.
If, however, the market begins to trend lower shortly after, it is a bull trap.
(ii) Technical Indicators
– Relative Strength Index (RSI)
RSI is a trading indicator that helps to confirm a market trend – whether bullish or bearish.
By default, the RSI measures the changes in an asset’s price over 14 periods ((14 months on monthly charts or 14 days on daily charts).
Typically, it helps traders to identify if the market is overbought, oversold, or a possible bullish or bearish divergence.
A bearish divergence indicates that despite a price rise, the market is losing momentum; this means a possible bull trap.
Further Read: The Relative Strength Index(RSI): How Good Is This Indicator?
– Fibonacci Retracement
The Fibonacci Retracement is a crypto trading indicator used to identify potential reversal levels.
It is calculated in the ratios known as the Fibonacci sequence, such as 23.6%, 38.2%, 50%, 61.8%, and so forth.
The ratios represent levels of support and resistance.
And it helps traders estimate how much upwards or downwards the market will go before the previous trend resumes.
So, with Fibonacci analysis, you could be just close to spotting a potential bull trap.
Further Read: Fibonacci Retracement – Is It Reliable?
These are the ways to spot a bull trap.
You might now be asking yourself how one can avoid a bull trap and perhaps even profit from it.
How To Avoid A Bull Trap And Profit From It
Well, I have a few tips for you. They include:
- Always conduct your analysis and wait for its confirmation before you attempt to trade
- Identify possible resistance and support levels and only execute short trades.
- Taking a short position when a bull trap is identified can be highly profitable in derivatives trading.
- Do not trade with emotions
Heads up!!
We developed a perfect course to help you master Cryptocurrency Trading.

Go to www.ctmastery.com to enroll.
You can also join our Telegram community at https://t.me/ctmastery for more information.
Conclusion
A bull trap can cause significant losses, but savvy traders who see it beforehand can profit handsomely from it.
We have reached the end of today’s post.
Now that you’ve read the post, I know you found it interesting and want to share your thoughts.
So tell me, have you been caught in a bull trap before?
Did you find this post helpful?
Write down your thoughts in the comments section right away.
And remember to share the post, just click on your fave social media button. Cheers
Also Read:

")

0 Comments