
Support and Resistance can help guide traders with entries and exits.
Support and resistance refer to areas on the chart where the price has a difficult time breaking through. Support levels are levels that tend to stop price from falling below a specific point and resistance levels are levels that act like a price ceiling that price cannot break above. Proper Knowledge of where these levels are will help make healthy trade opening and closing decisions.
The big question now is how can we locate these prices?
We will cover 3 simple ways to identify support and resistance.
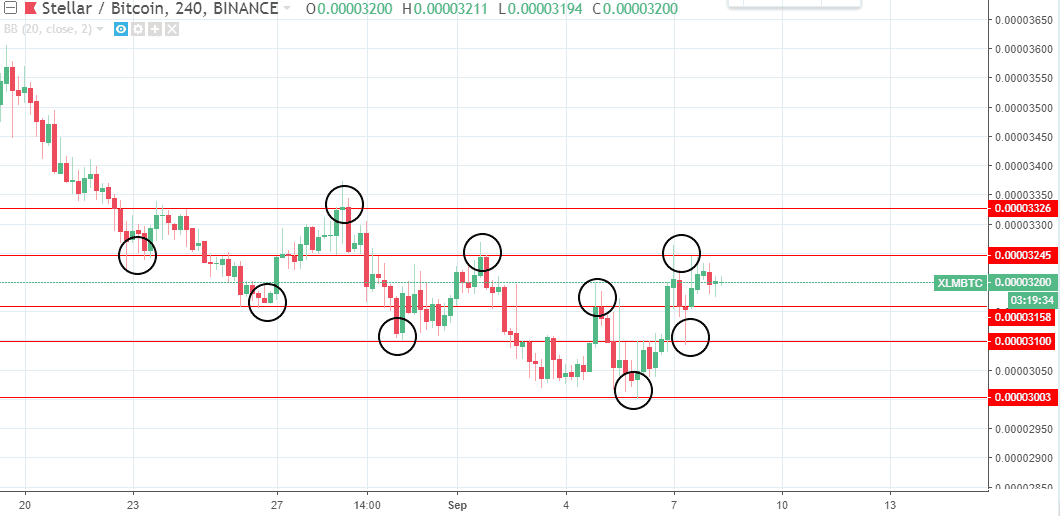
1. Swing Highs and Lows
The best way to find support and resistance levels is to mark levels in the past where price had a difficult time breaking through. As price moves up and down, each level that price has bounced off could be a level in the future that price bounces off again. This is the manual method and takes time to draw on all the currency pairs that we trade, but can pay off in the long run.
2. Psychological Levels
Often called “psych” levels, psychological levels occur when the price ends with multiple 0’s. It’s natural for us humans to round off numbers to the nearest tenth, hundredth, thousandth, etc., when discussing, making calculations or assumptions, cryptocurrency included.
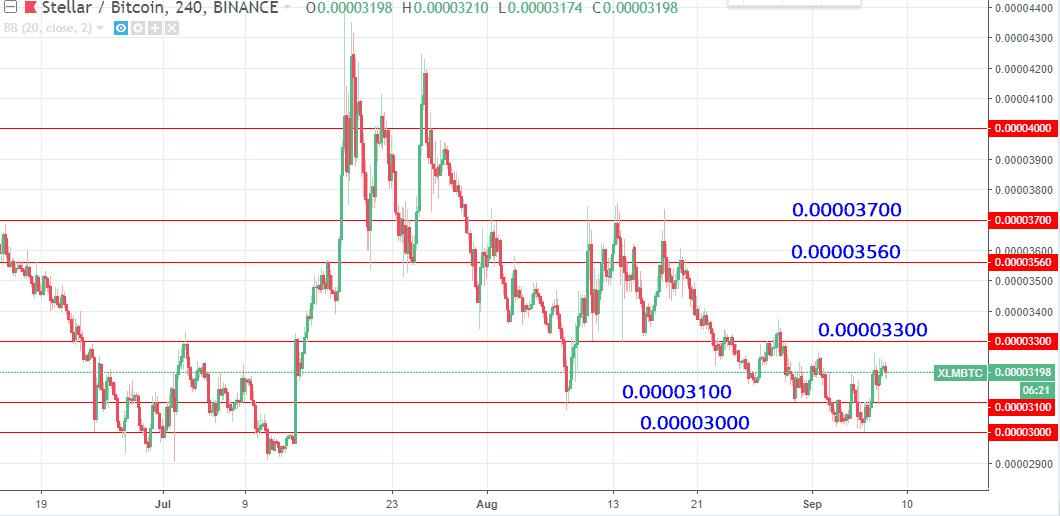
For instance, XLM in the chart above has supports and resistances. When predicting the support and resistance you will likely use 0.00003300 and 0.00003100 instead of 0.00003332 and 0.00002994.
The most common psych levels involve price having two zeros at the end, more powerful than that would be psych levels ending in three zeros, and most powerful psych levels of all are those of four zeros at the end.
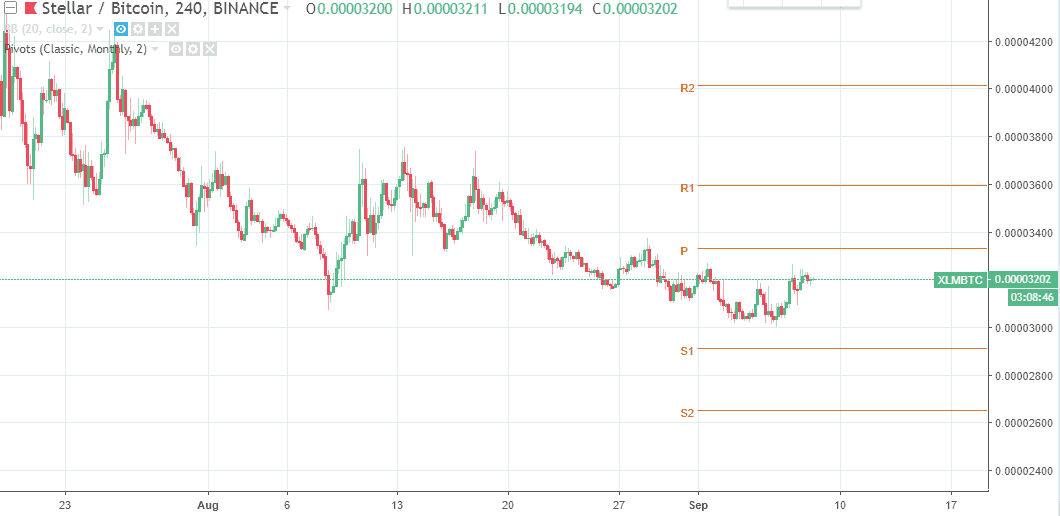
3. Pivot Points
Arguably the easiest support and resistance levels to add to our charts, pivot points are a built-in indicator on many platforms that will automatically draw key levels without any effort on our part at all. Pivot points are created by the previous period’s High, Low and Close prices, with the most common period size being the Daily period. We will discuss this extensively in our subsequent posts.
Conclusion
Support and resistance are sometimes thought to be difficult to plot nevertheless, it doesn’t have to be confusing. We can mix and match any of the methods above and create a healthy amount of price levels that we can trade. As always, practice makes perfect.

")

0 Comments