
In the #3 of the Chart 101 series, together we looked at MACD, a crypto trading indicator and today, the Bollinger Bands is next in line.
Bollinger Bands(BB) is a volatility-based indicator that has a variety of applications.
It is composed of 3 lines: a simple moving average (middle band), a higher and a lower band.
These bands move with the market price, widening or narrowing in accordance with volatility.
Bollinger Bands is used on all timeframes – daily, hourly, weekly, or five-minute charts.
This post will teach you the purposes of Bollinger Bands and how to apply them in trading.
Get together your writing materials and let’s set out together to explore the BB-verse.
Post Summary
- Bollinger Bands(BB) Explained
- How Does It Work?
- Ways to Use Bollinger Bands
- Bollinger Bands in Crypto Trading
- Frequently Asked Questions (FAQs)
- Conclusion
You can access the full details of any of the points by clicking on it.
With that said, let’s get to work discussing them immediately.
**Heads up!!
Today’s post is #4 in the Chart 101 series.
For a complete understanding of the series, read in this order:
- Crypto Trading Indicators – What are They?
- Fibonacci Retracement – Is It Reliable?
- Moving Average Convergence Divergence(MACD) – A Complete Analysis
- Bollinger Bands – How Good Is This Indicator?
- Relative Strength Index(RSI) – An In-depth Review
- The Moving Average(MA) Analyzed -A Complete Guide
- Engulfing Candlestick Pattern – How Does It Work?
Bollinger Bands (BB) Explained
Bollinger( pronounced bol-leen-jah) Bands is a popular indicator that helps traders to determine possible buy/sell points as well as when an asset might make a big move.
John Bollinger, a long-time technician of the markets invented it.
He developed the technique of using a moving average with 2 trading bands (above and below).
These bands move with the market price, widening or narrowing as volatility increases or decreases.
The position of the bands however and the way the price acts in relevance to the bands provides data concerning how robust the trend is and potential bottom or topping signals.
Moving on from here now to talk about how BB works.
Stay with me.
How Does Bollinger Bands Work?
Let’s break it down bit by bit!
Understanding the Standard Deviation(SD)
To fully understand BB, let’s take a look at Standard Deviation.
Standard Deviation(SD) is a measure of how far an asset’s price is from its average and typical price.
1 SD is a little bit higher or lower than the average or typical asset price. It occurs frequently.
2 SD occurs occasionally and is a lot higher or lower than the average or typical asset price.
The 3 SD occurs rarely and is a whole lot higher or lower than the price of the asset.
BB’s Modus Operandi
Now back to how BB works.
Bollinger Bands comprises of 3 lines:
- a middle band (which is usually a 20-day Simple Moving Average[SMA])
- a higher band (gotten thus: 20-day SMA + 20-day SD x 2)
- a lower band (calculated thus: 20-day SMA – 20-day SD x 2)
The middle band represents the average price of an asset while the upper and the lower bands show how far away the asset’s price is from its average price.
The upper band is 2 SDs above the average asset price while the lower band is 2 SDs below the average price of the asset.
Now, in a ‘normal’ market, an asset’s price would stay within the upper and lower bands 95% of the time.
Though in reality, the crypto-verse knows no normalcy, but an asset’s price is still expected to remain within the bands about 90% of the time.
So, some traders may decide to buy when it touches the lower band and sell when it touches the upper band.
But at other times too, the price can break through the bands.
There are points when a ‘Squeeze’ is experienced i.e when the upper and the lower band come together. This is caused by lots of changes in price.
Squeezes are believed to always precede a spike up in price and help traders to identify when to enter or leave the market.
I explained ways you can use BB below.
Let’s meet up in the next section.
Ways to Use Bollinger Bands
Bollinger Bands indicator is employed by traders as a methodical tool to inform trading decisions and to control automated trading systems.
The first way to use Bollinger Bands is for analysis. This information can then be used to confirm trade signals from other indicators or strategies to make trades.
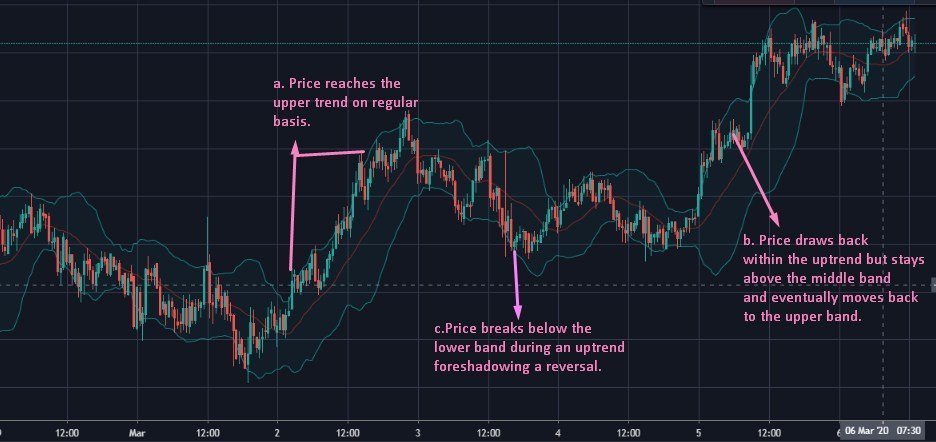
For an uptrend:
a. If an uptrend is strong, it will reach the upper band on a regular basis. Reaching the upper band shows that the coin is pushing higher and buying activity remains strong.
b. When the price draws back within the uptrend and if it stays above the middle band and then moves back to the upper band, it shows a lot of strength.
c. If during an uptrend, the price breaks below the lower band, it is a warning that the uptrend has slowed and may be reversing.
The same principles apply to a downtrend.
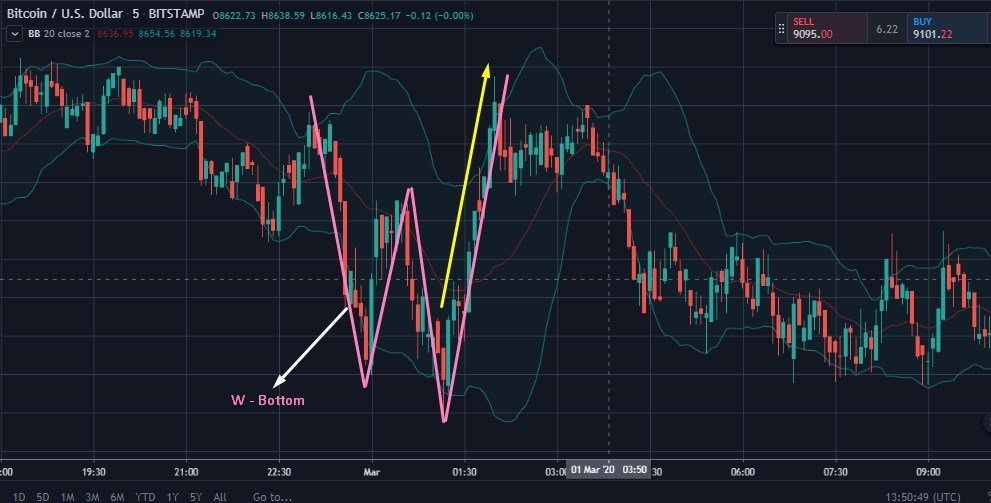
Another way to use Bollinger Bands is for trading W(Double)-Bottoms and M(Double)-Tops.
Our main focus will be on the W-Bottom because we only make money on the rise of a coin’s market price.
A W-Bottom signals a reversal from a downtrend into an uptrend and an M-Top signal a reversal from an uptrend into a downtrend.
Initially, there is a wave lower, which gets close to or moves below the lower band.
The price then pulls back to the middle band or higher, and proceeds to create a lower price low than the prior wave, but doesn’t close below the lower Bollinger Band.
When the price moves above the high of the prior pullback, the W-Bottom is in place.
Having pointed out ways you can use this indicator, I will now explain how to use it when trading cryptos.
Just scroll down.
Bollinger Bands in Crypto Trading
Trading using BB involves the following steps:
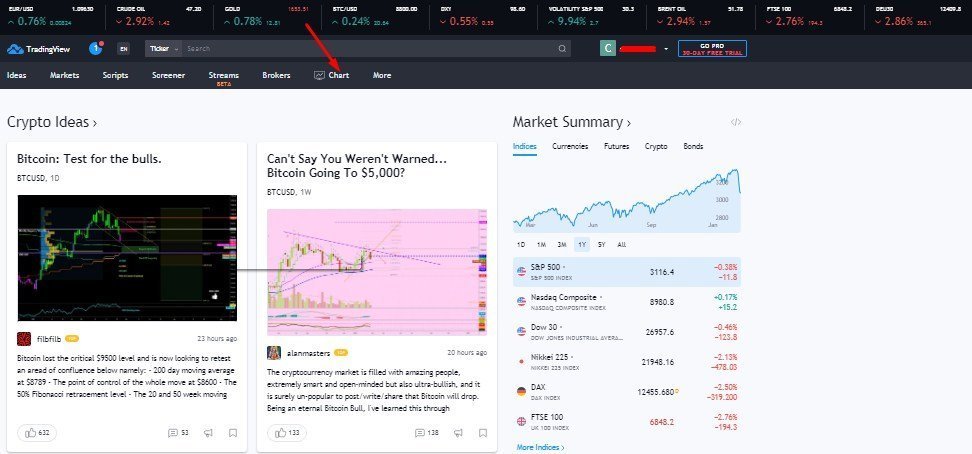
- Create an account or log into a crypto trading platform e.g tradingview.com
- Click on ‘Chart’ to access the trade area.
- Select the cryptocurrency of choice
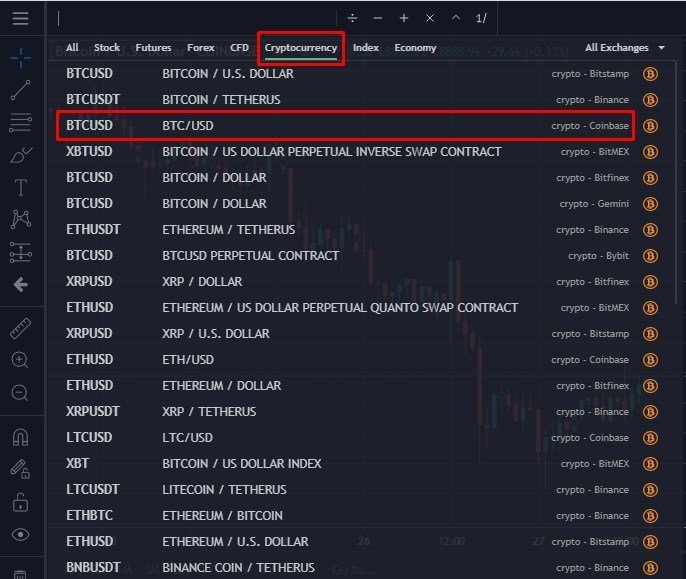
- Select a time frame (minutes, hours, days, weeks, etc)

- Click on ‘Indicators’ at the top of the chart and select ‘Bollinger Bands’ from the dropdown menu

- The indicator is then displayed on the chart. Bollinger Bands have 2 adjustable settings which are the period and standard deviation. A band denoted (20, 2) depicts that the period and standard deviation are set to twenty and two respectively.

Once the BB is drawn, you can then make your deductions on when to enter or leave a trade.
Since about 95% of the action happens within the bands, traders only get excited when it goes beyond the upper or lower bands.
A common mistake people make is to buy or sell at these points.
For example, when you have the price well below the lower band, you consider the market is oversold and then you buy. Or when the candlestick goes above the upper band, you say the market is overbought and then you sell.
That is not usually the case with BB. The first candlestick that goes above either direction is taken to be an initial continuation signal.
And that is how you use Bollinger Bands in crypto trading.
I will go ahead to answer some FAQs about BB below.
Frequently Asked Questions(FAQs)
Bollinger Band is a helpful indicator, but they have a number of limitations. It is derived from a simple moving average which means that Bollinger Bands will always react to price moves, but won’t forecast them.
Trading with it is very easy but needs to be used alongside another indicator for confirmations.
Some other indicators that you can use Bollinger Bands with include:
1. Relative Strength Index(RSI)
2. Moving Average Convergence Divergence(MACD)
3. Average True Range(ATR), etc
The Bollinger Bands ‘squeeze’ occurs when the volatility falls to lower levels and the BB narrows. Therefore, a contraction of the bands presages a significant increase or decline.
[widget id=”custom_html-4″]
Learn How To Trade
If you want to learn how to trade cryptocurrencies profitably, sign up for free on Afibie.
You can join our Telegram channel, where we hold live sessions and give trade signals.
Conclusion
The Bollinger Bands indicator is designed to depict the volatility of a coin.
It is quite simple, being composed of a simple moving average, upper and lower bands that are 2 standard deviations away.
But BB is not all-encompassing; it is simply one indicator designed to provide traders with information regarding price volatility.
John Bollinger suggests that it should be used with 2 or 3 other indicators that provide more direct market signals.
Having exhausted all the points, I bring to an end the discussion of today.
Hope you’ve gotten a full grasp of Bollinger Bands or you are still not clear about something?
Have you used this indicator when trading? How helpful was it?
What other indicators do you think will aid BB to perform optimally?
Fill me in on your thoughts in the comment section below.
And don’t forget to click the share button below…It ain’t fun when your buddies gat none!
Have you checked out these awesome contents from us?

")

0 Comments